SALVIA-OCT.-web (Program for onboard data analysis)
SALVIA-OCT.-web is a program for assessing the performance of a ship in actual seas based on onboard monitoring data using the standard onboard monitoring method.

Outline
SALVIA-OCT.-web is a program for assessing the performance of a ship in actual seas based on onboard monitoring data using the standard onboard monitoring method.
Interface
The SALVIA-OCT.-web. is a web application which is provided with interface shown below.The output data can be used in OCTARVIA-index/prediction.
The output data can be used in OCTARVIA-index/prediction.
As input support functions, you can directly import output files from EAGLE-OCT.-web, OCTARVIA web Prediction Mode (calculation of external forces due to winds and waves), and MiPoLin®. Additionally, the output from this app can be used with OCTARVIA-web Index Mode and Prediction Mode (prediction of ship performance in actual seas and estimation of the life cycle fuel consumption of the main engine).
EAGLE-OCT.-web and OCTARVIA-web are apps on NMRI Cloud.
MiPoLin® is a user-friendly, highly accurate power prediction and lines selection system provided by Mitsubishi Shipbuilding Co., Ltd. No additional fees are incurred for importing MiPoLin® data into SALVIA-OCT.-web.
Detailed information for MiPoLin® can be found at the following website.
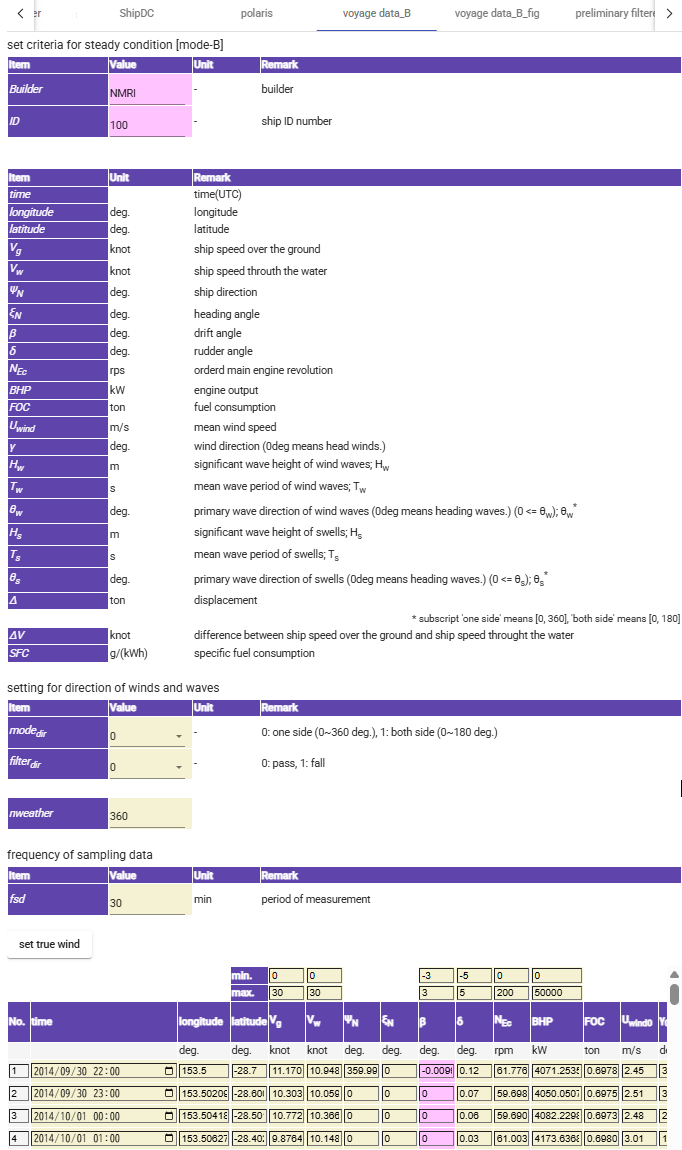
Display of Input
Display of Output
SALVIA-OCT.-web. Estimation Process
(1) Data Filtering
Data filtering is performed based on filtering thresholds for the operating and weather conditions.
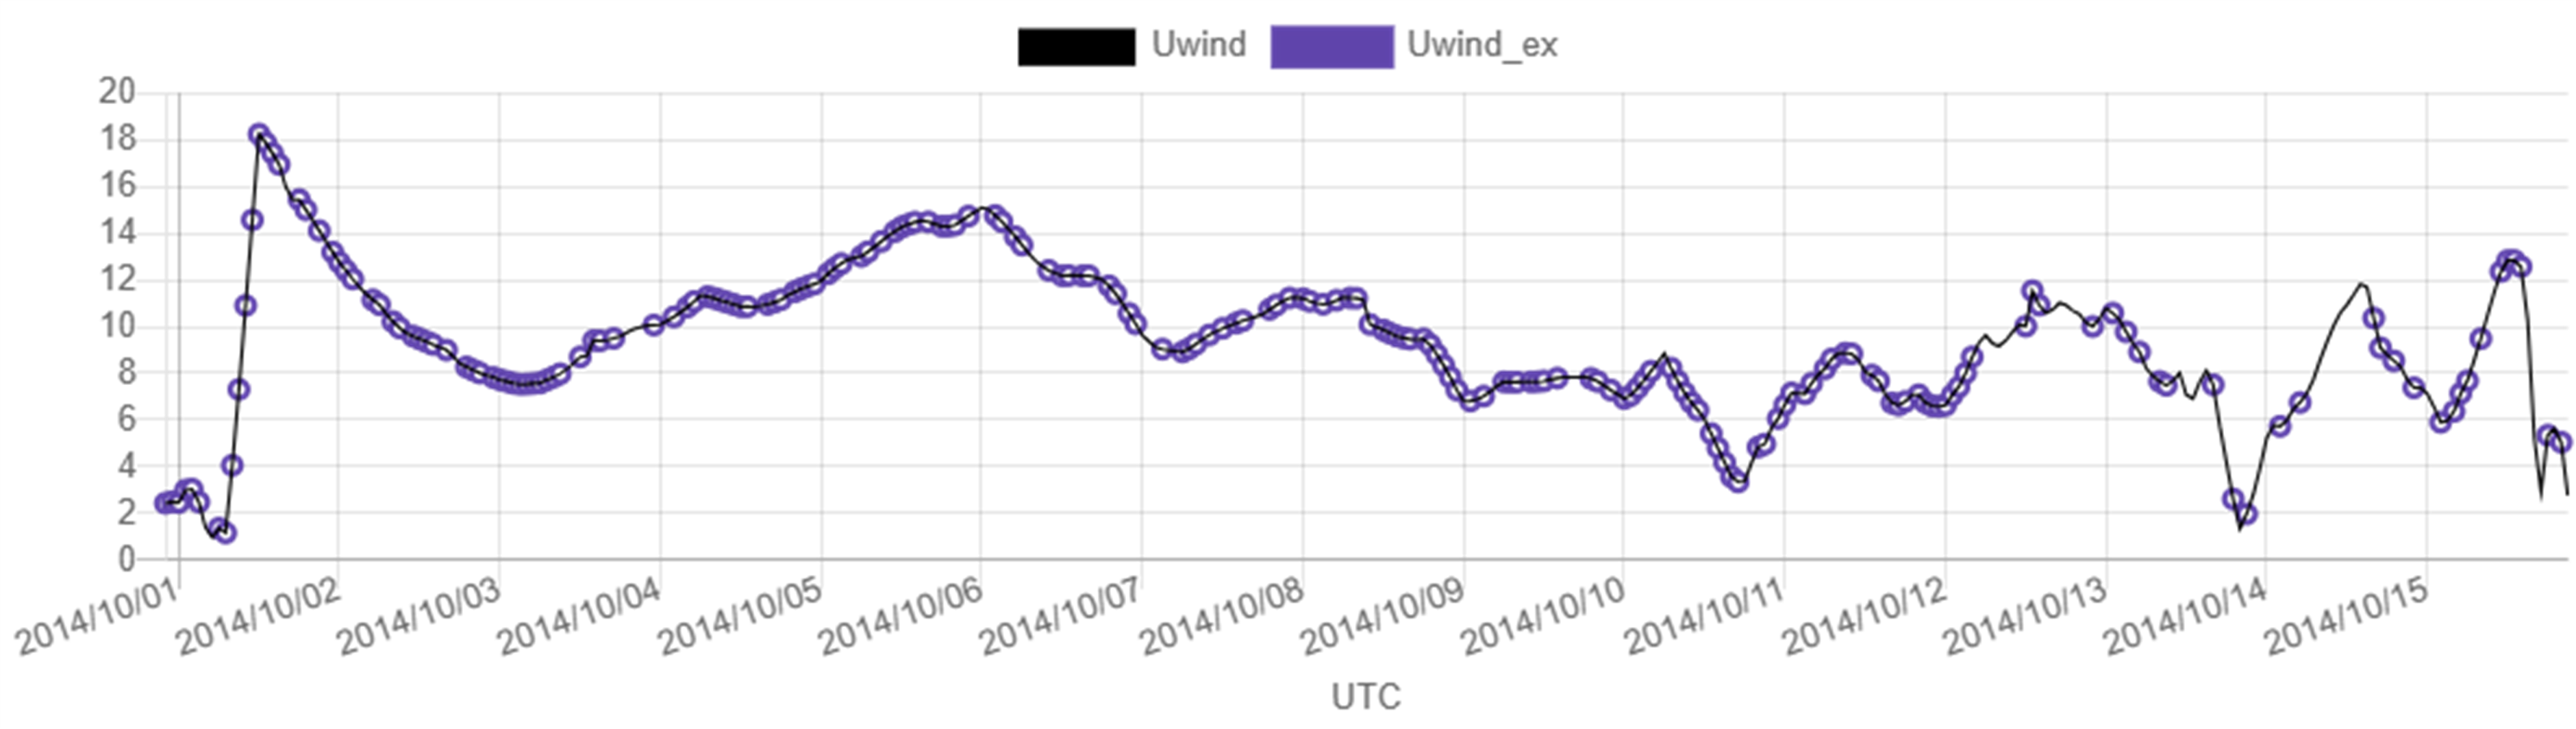
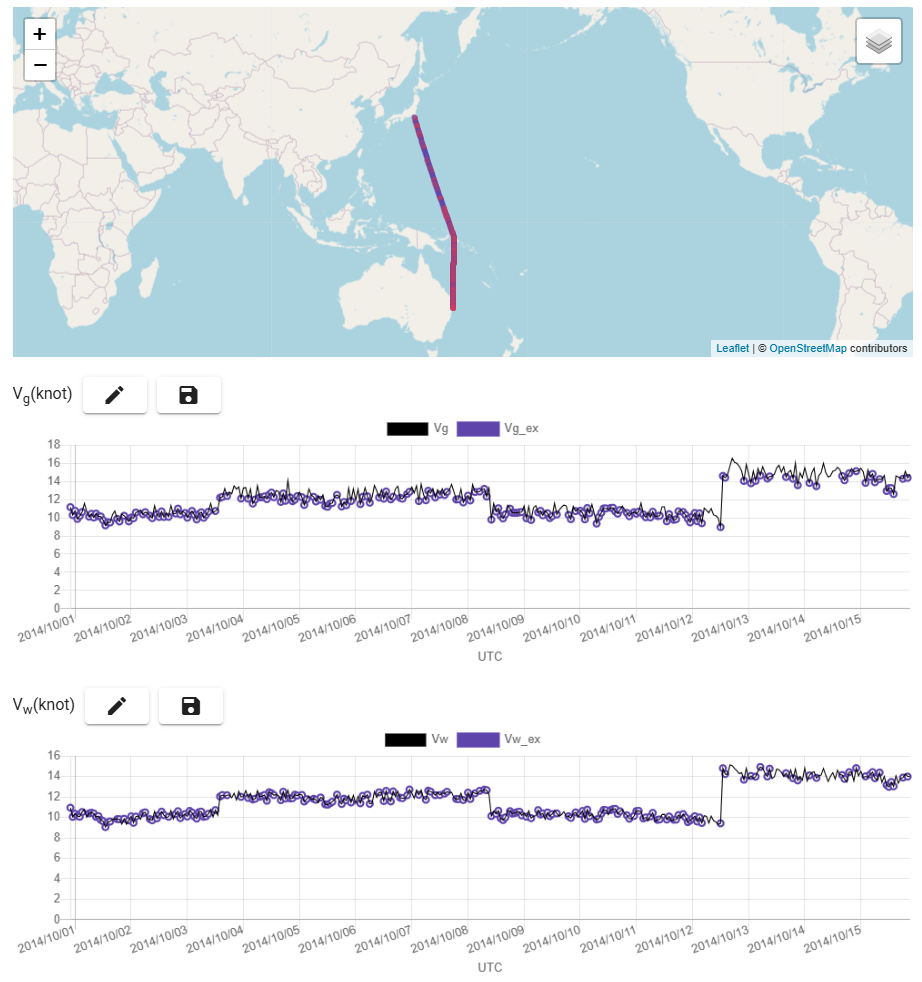
Input example (Uwind : absolute wind speed, Uwind_ex : extracted absolute wind speed)
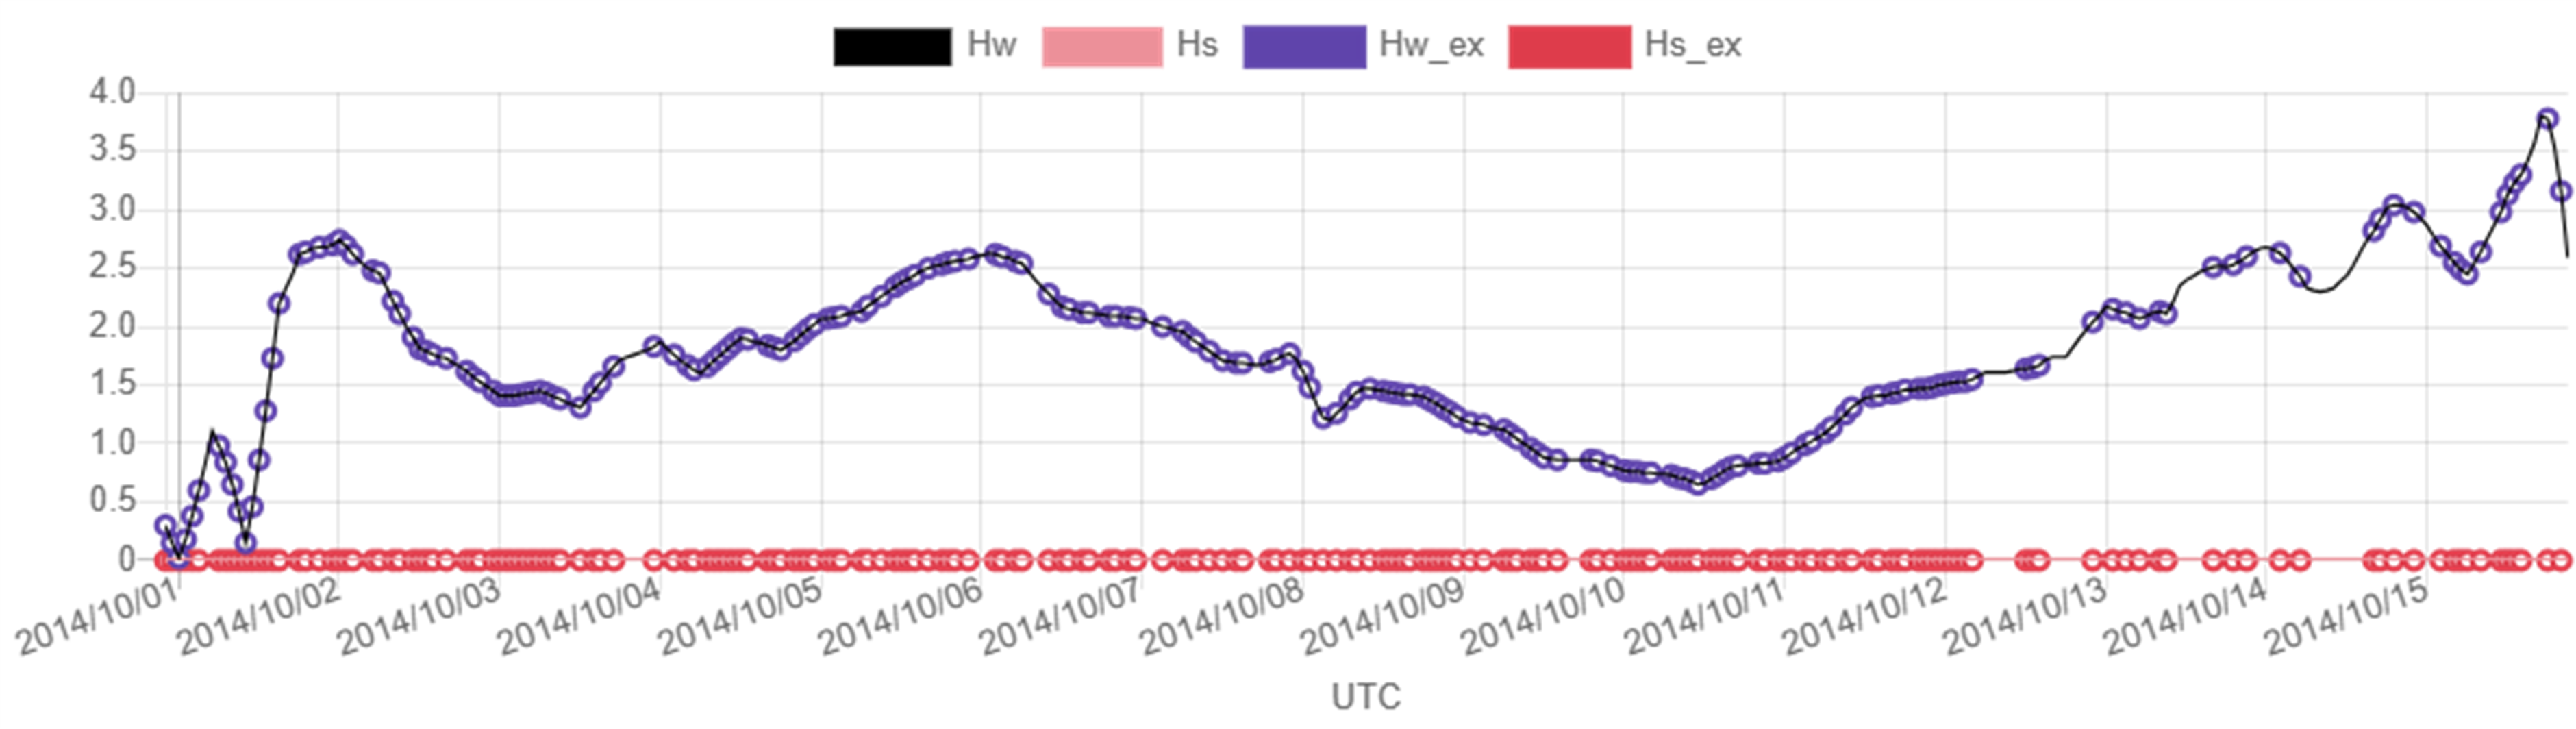
Input example (Hw : significant wave height(wind waves), Hw_ex : extracted significant wave height (wind waves), Hs : significant wave height (swells), Hs_ex : extracted significant wave height (swells)
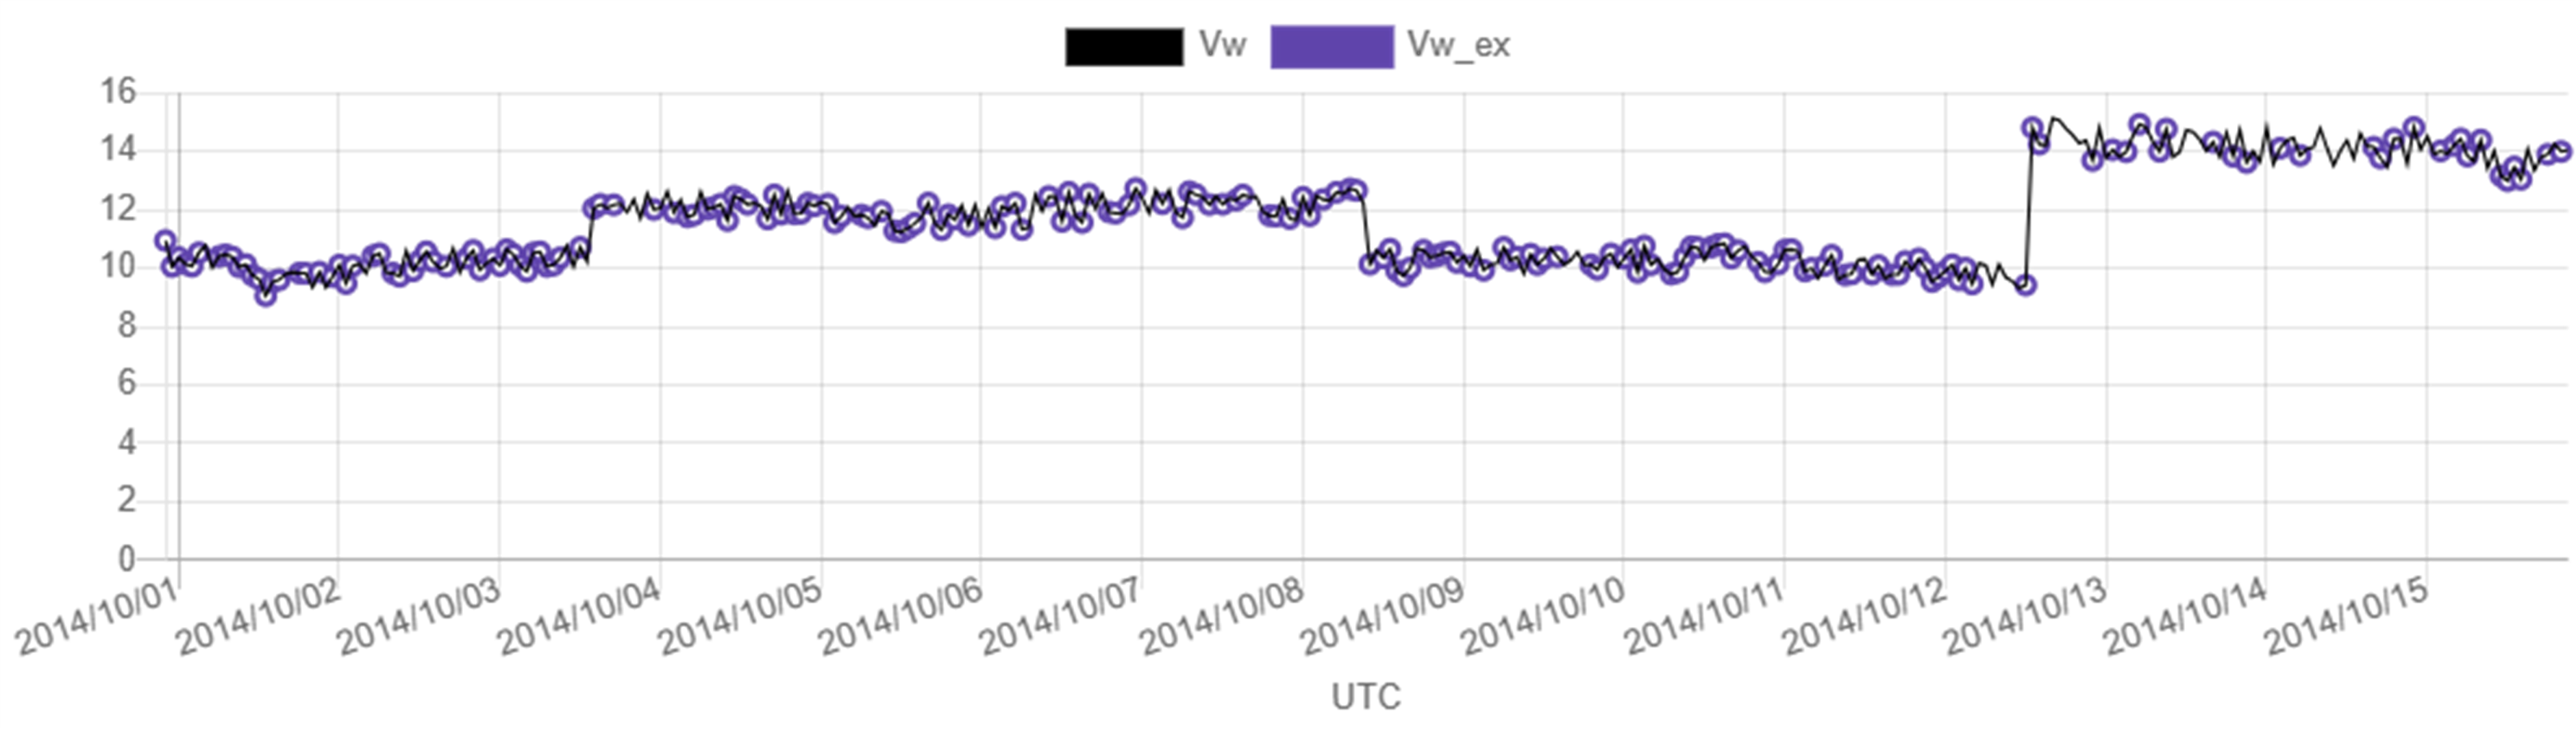
Input example (Vw : ship speed through water, Vw_ex : extracted ship speed through water)
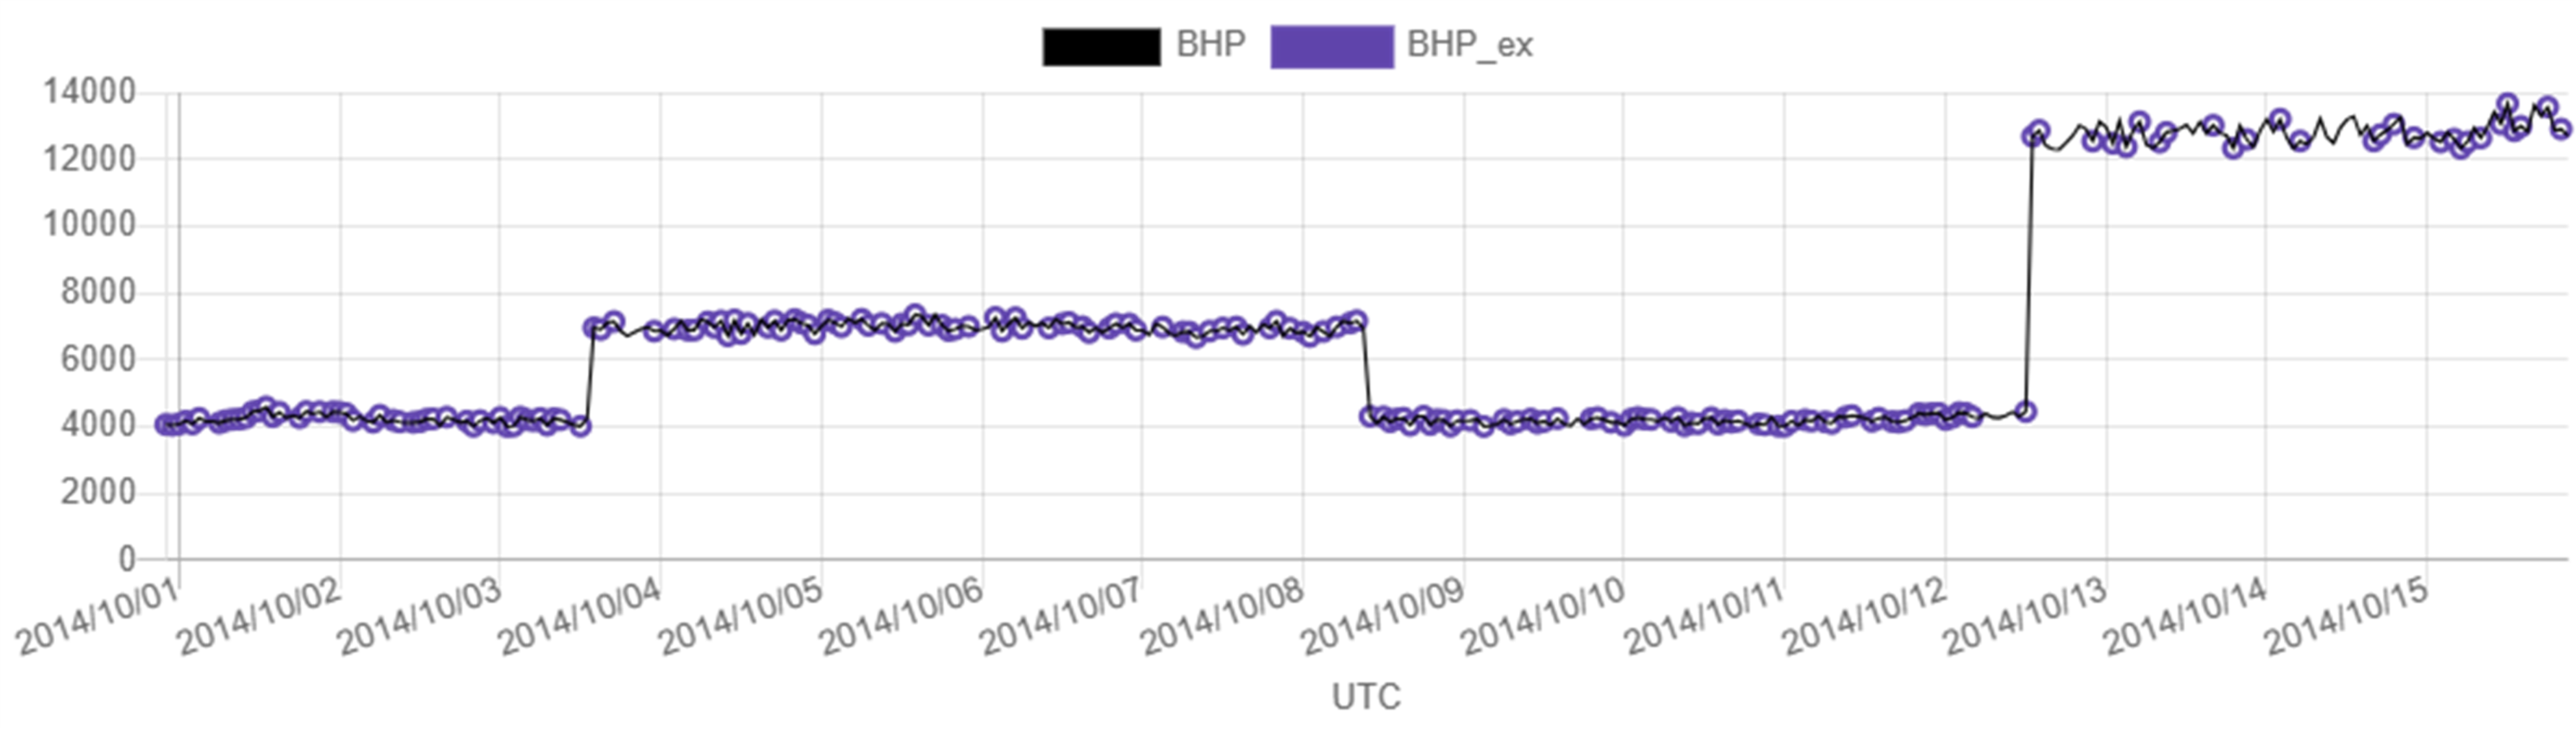
Input example(BHP : main engine power, BHP_ex : extracted main engine power)
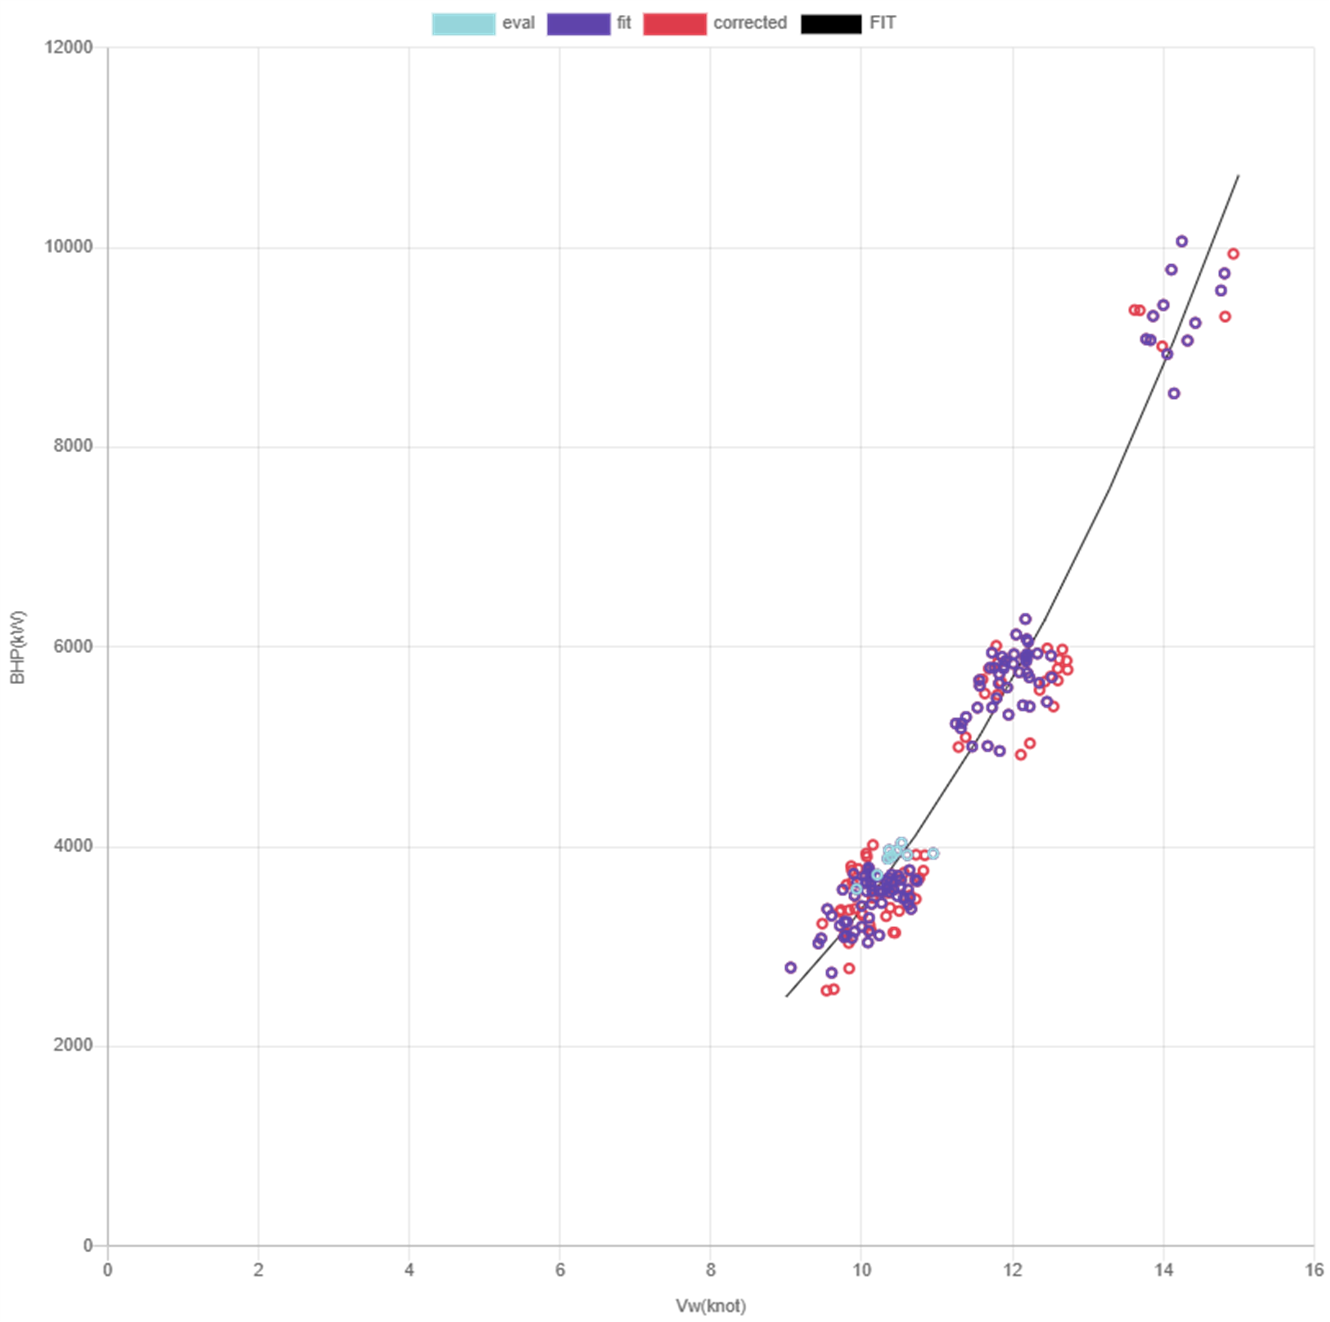
(2) Correction for the Effects of Winds and Waves
Onboard monitoring data for the rotational speed and output power of the main engine are corrected to the values for the given weather conditions, such as calm condition.
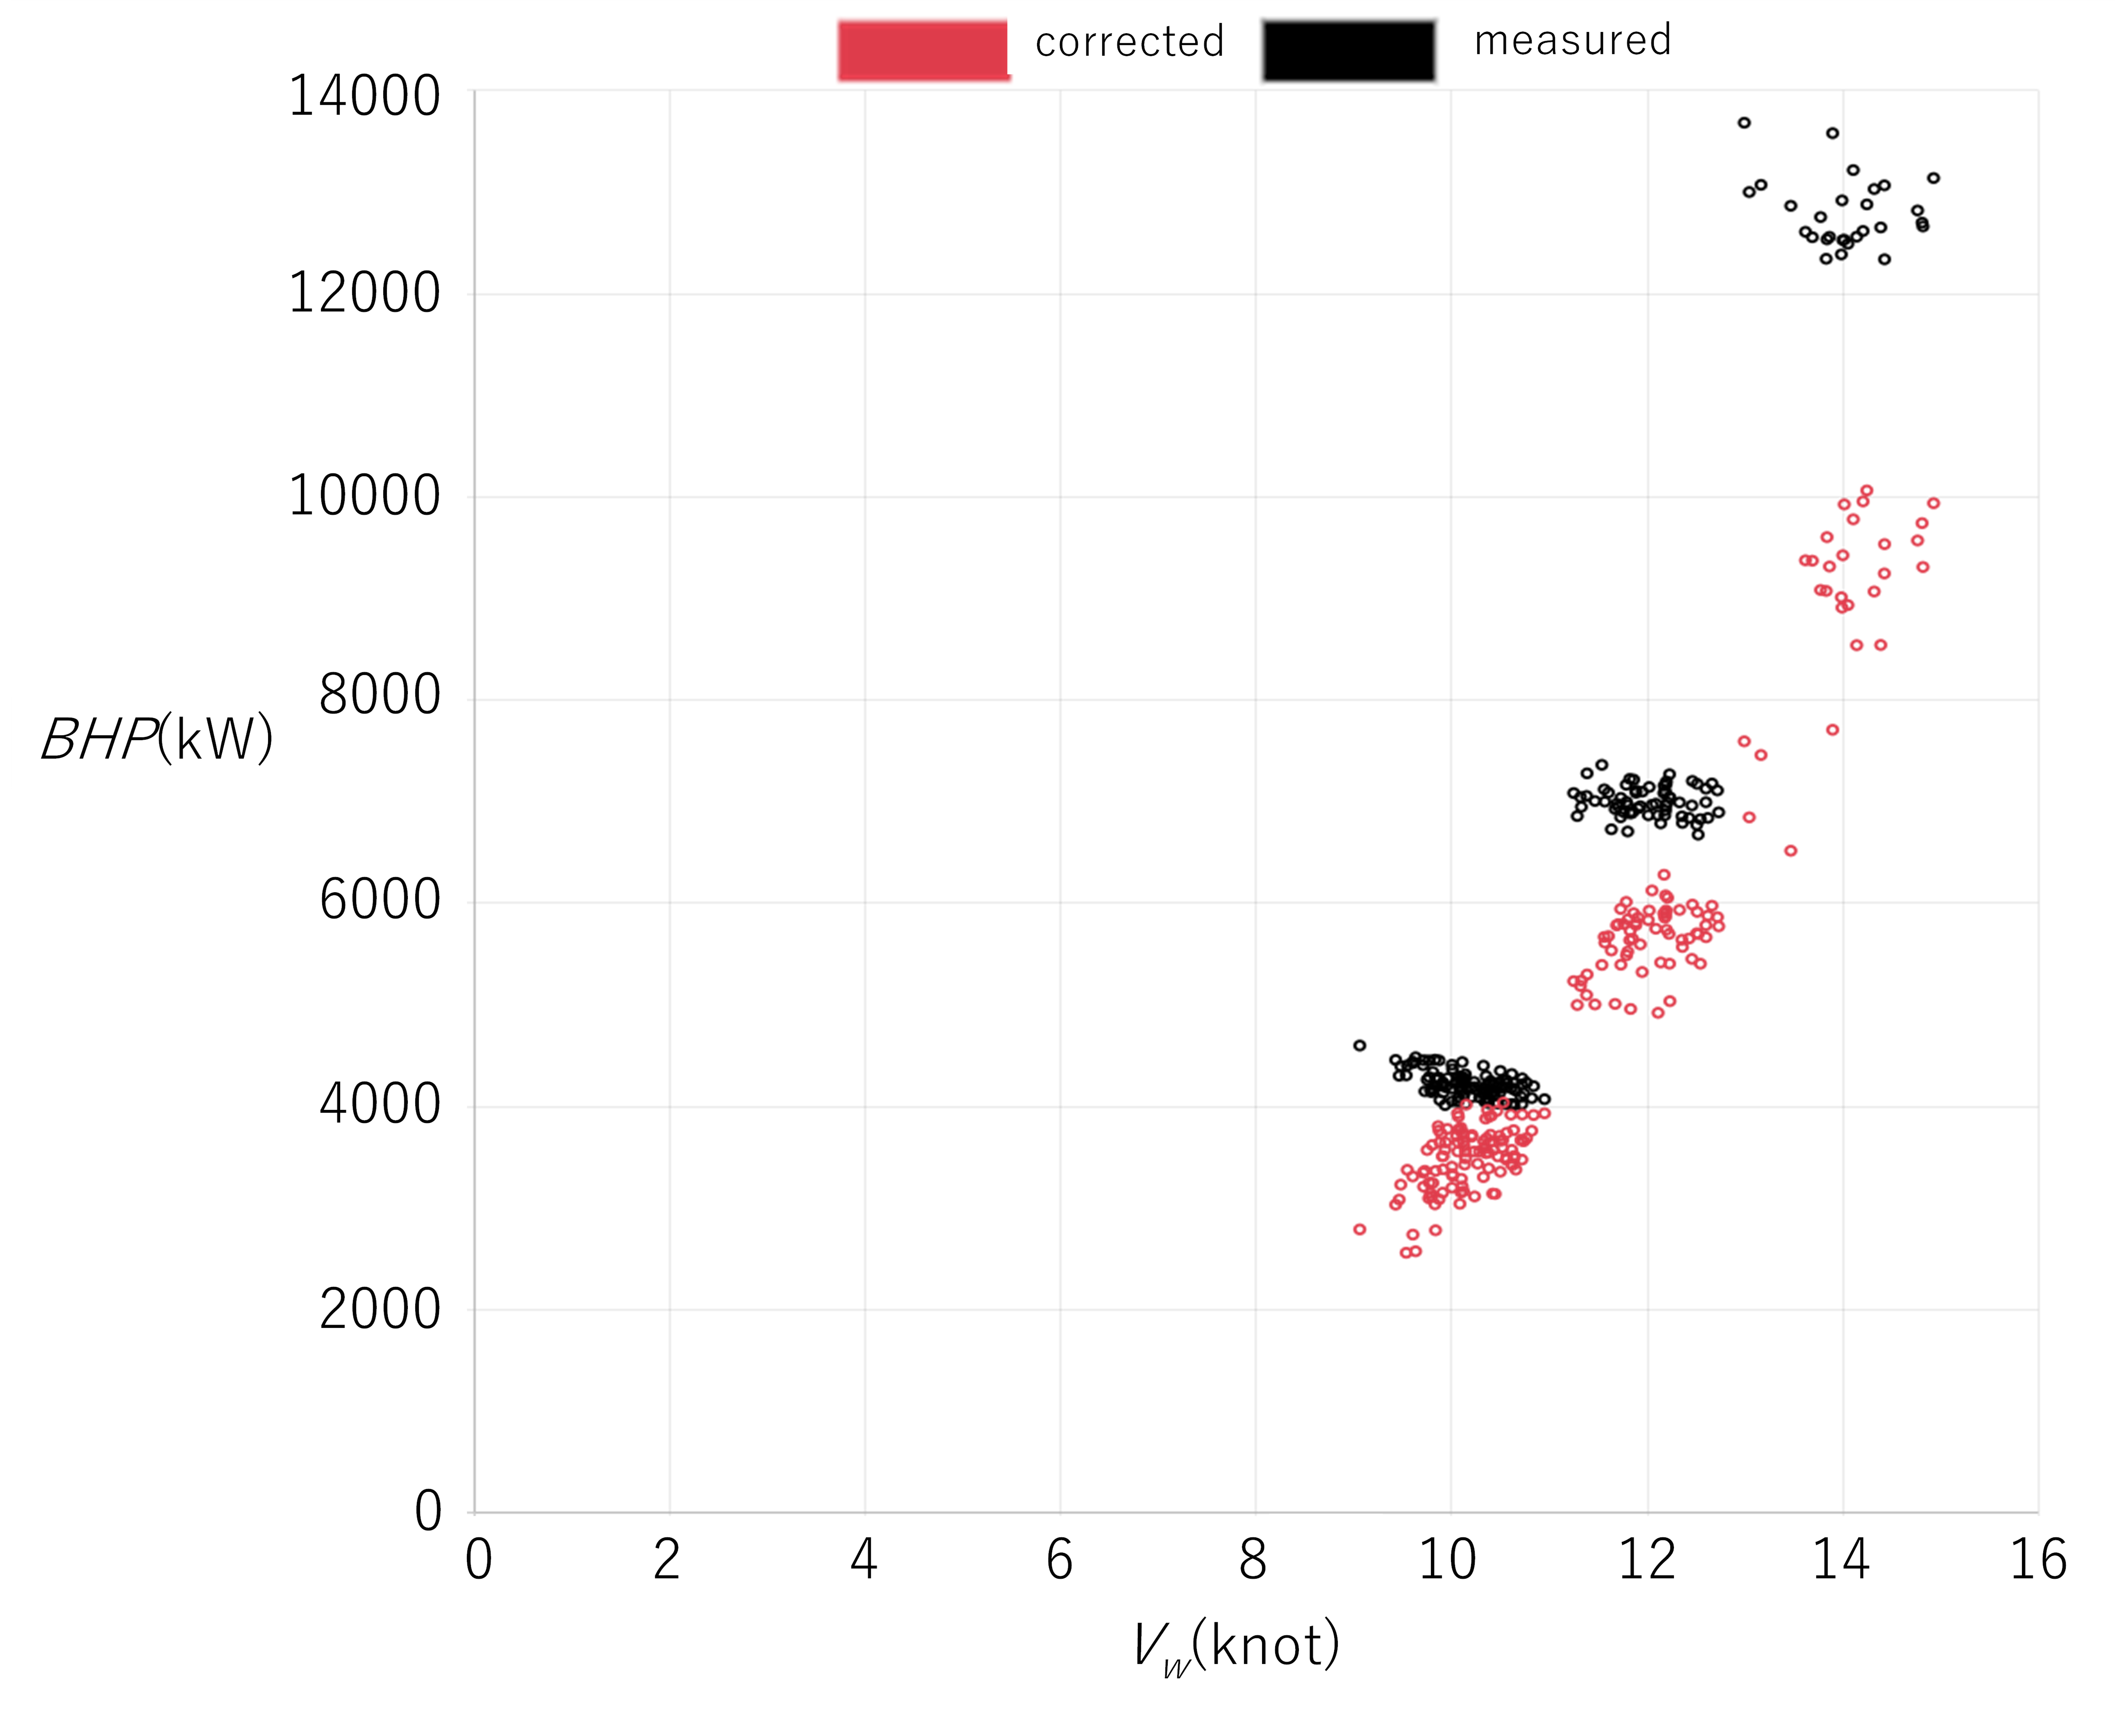
Correction to Ship Performance in Still Water (ship speed – engine power)
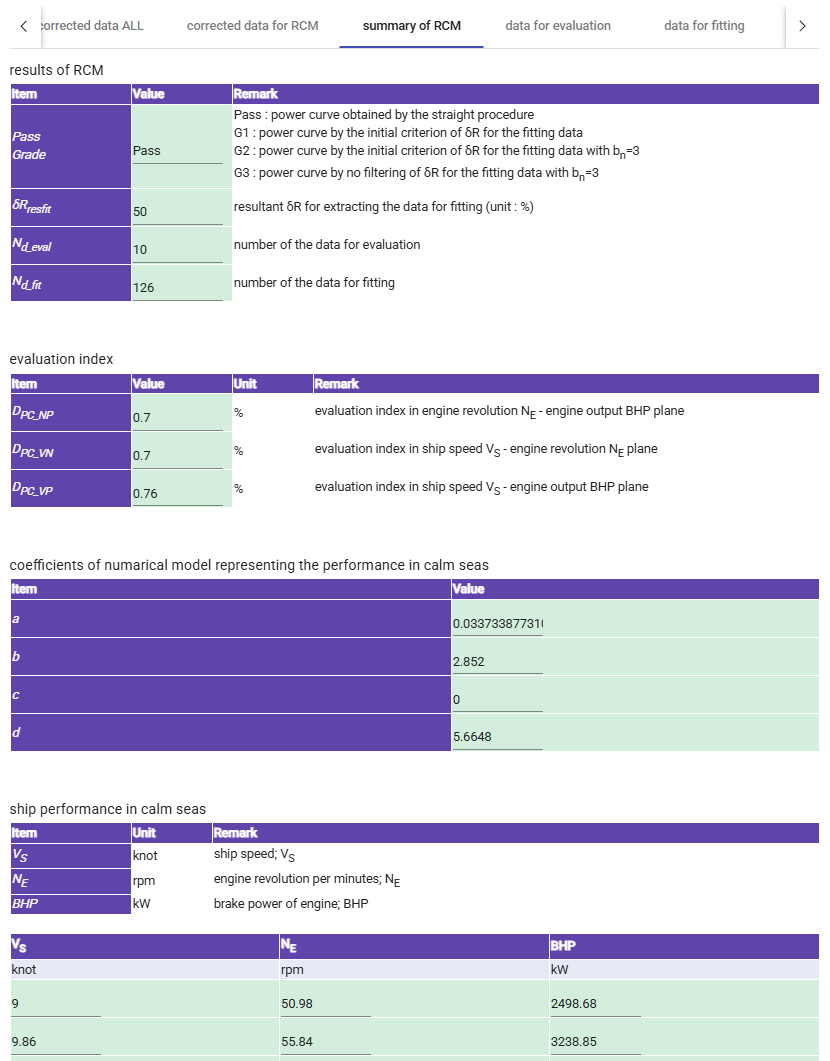
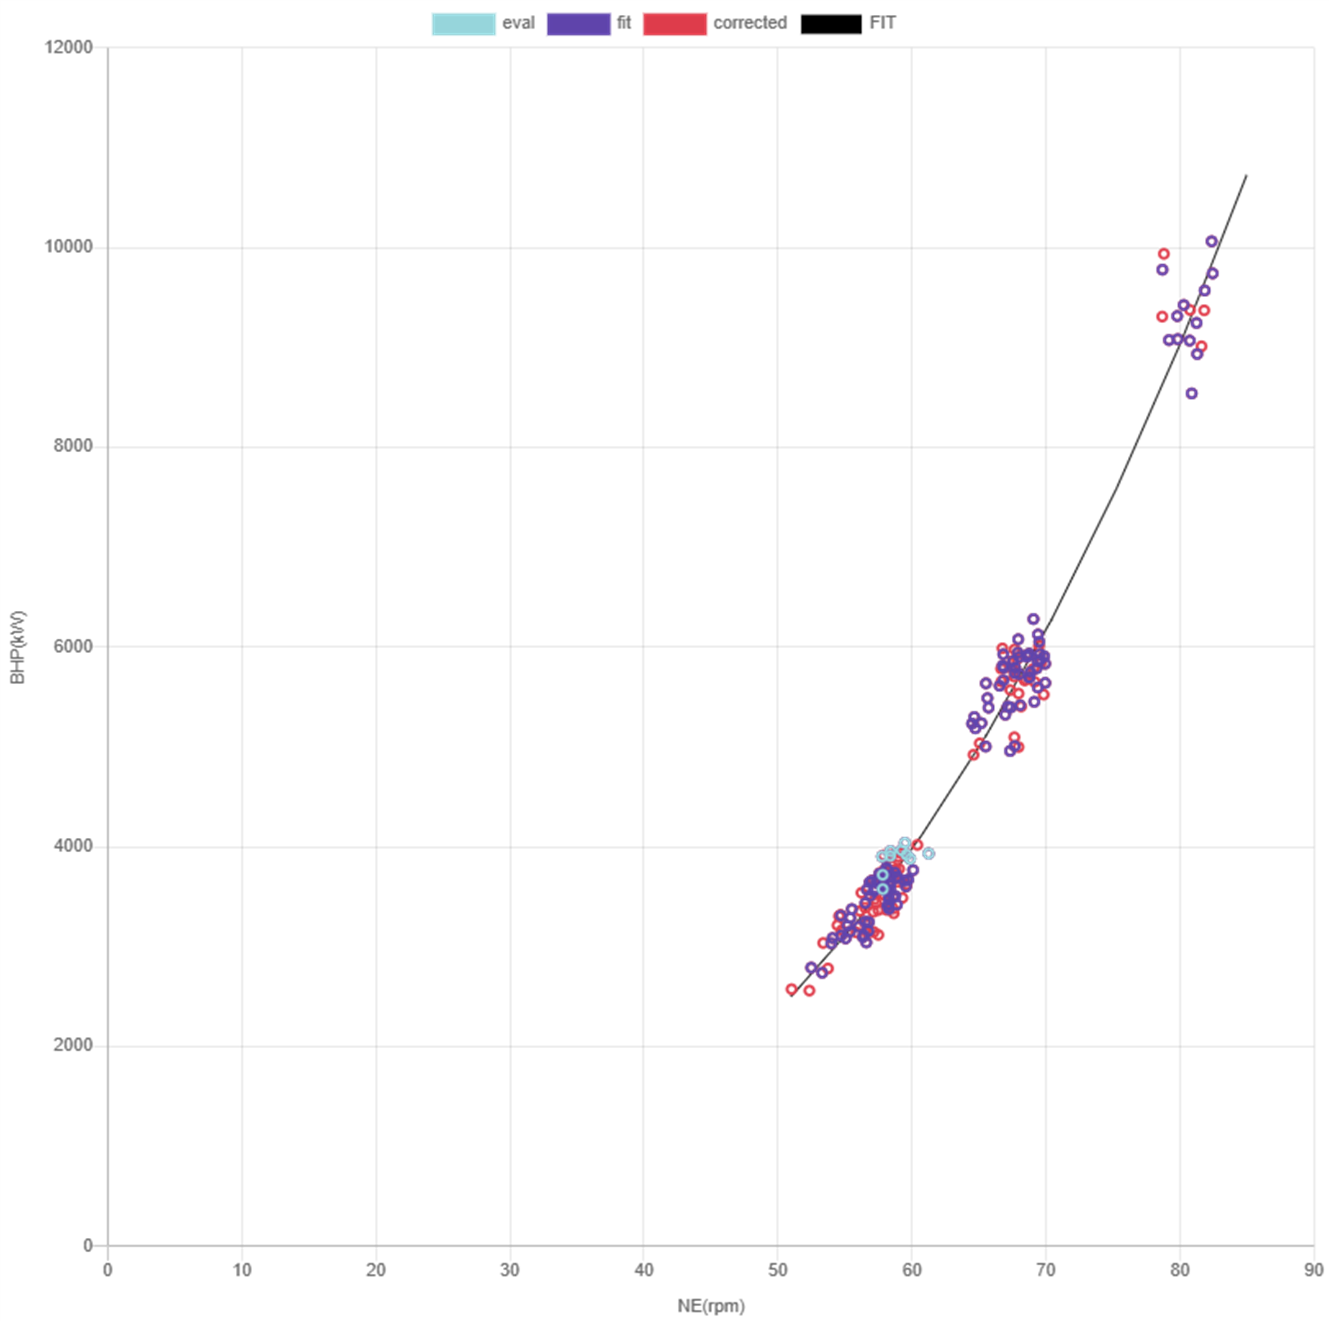
(3) Assessment of Ship Performance in Still Water (including quality assessment)
SALVIA-OCT.-web. assesses the performance of the ship in given weather conditions set by the resistance criteria method1)2) using the corrected data and presents the relationship between the speed of the ship through water, main engine rotational speed and main engine power. It also presents the results of quality assessment of the output data (pass grade).
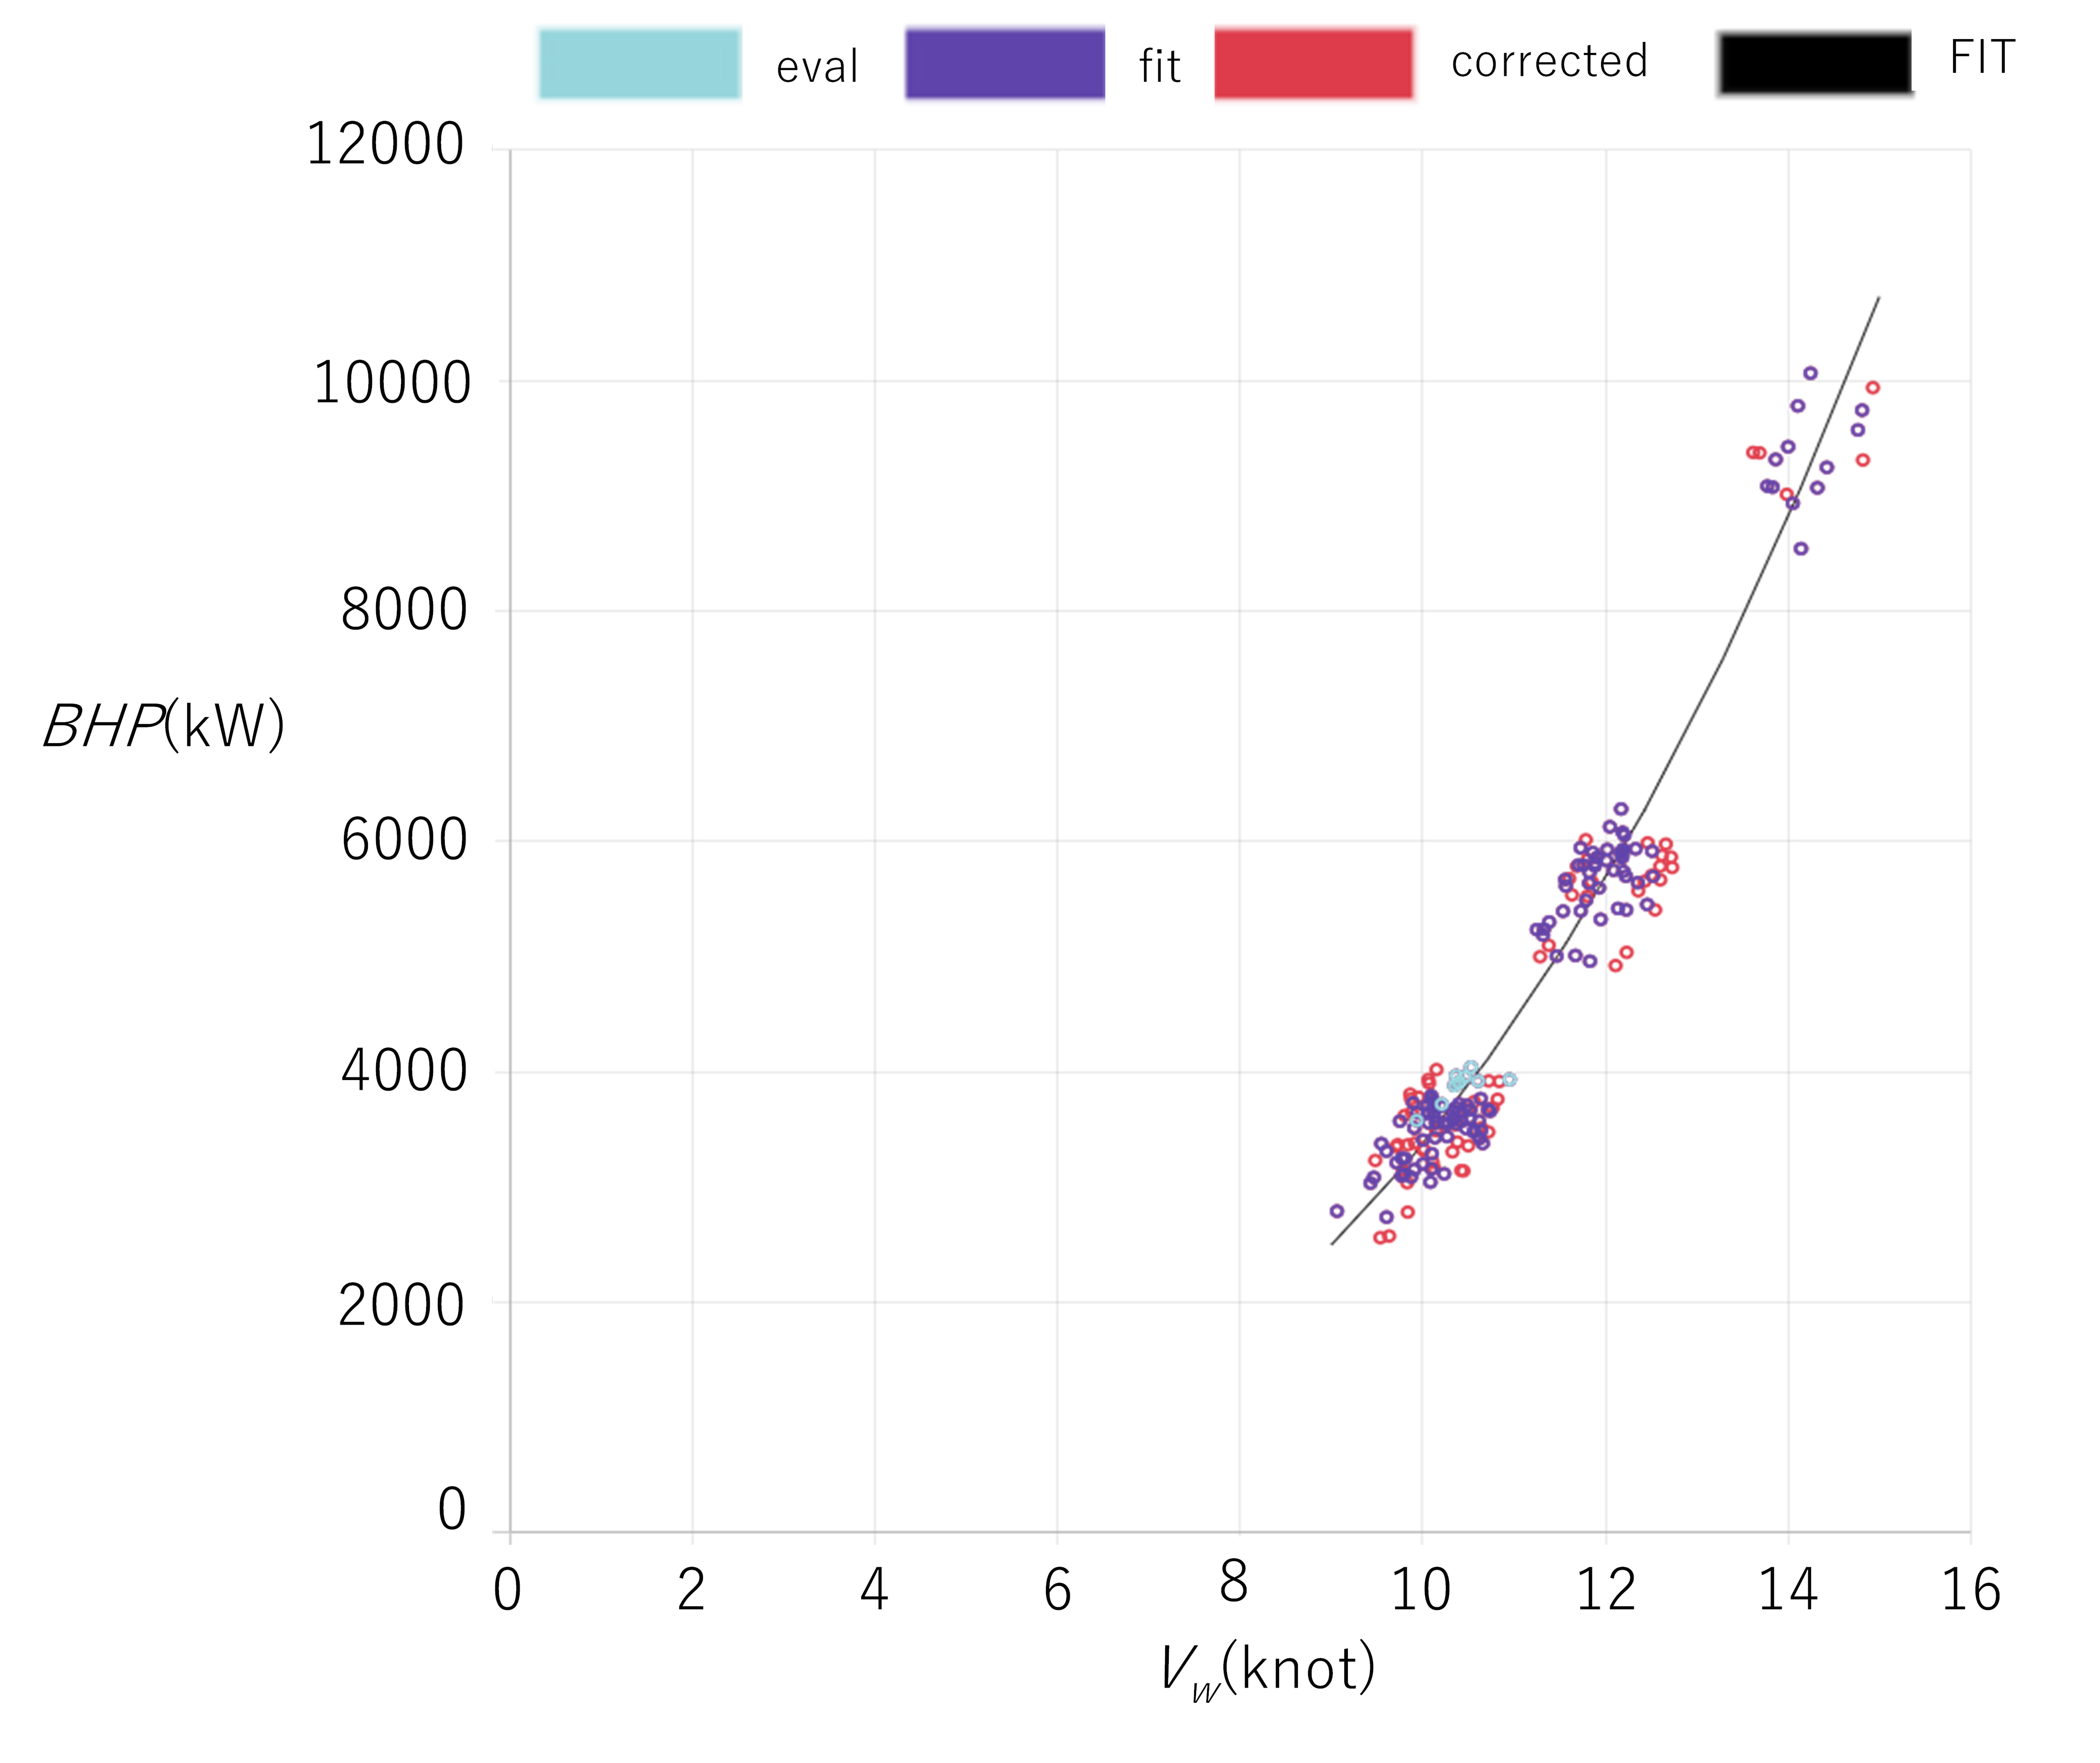
Results of Assessment of Ship Performance in Still Water based on Onboard Monitoring Data (ship speed – engine power)
The effectiveness of this assessment method was validated by the comparison with the results of the fuel consumption simulation by OCTARVIA-prediction. It has been confirmed that there is only an approx. 2% difference between the simulation and the onboard monitoring data for the ship performance in still water3).
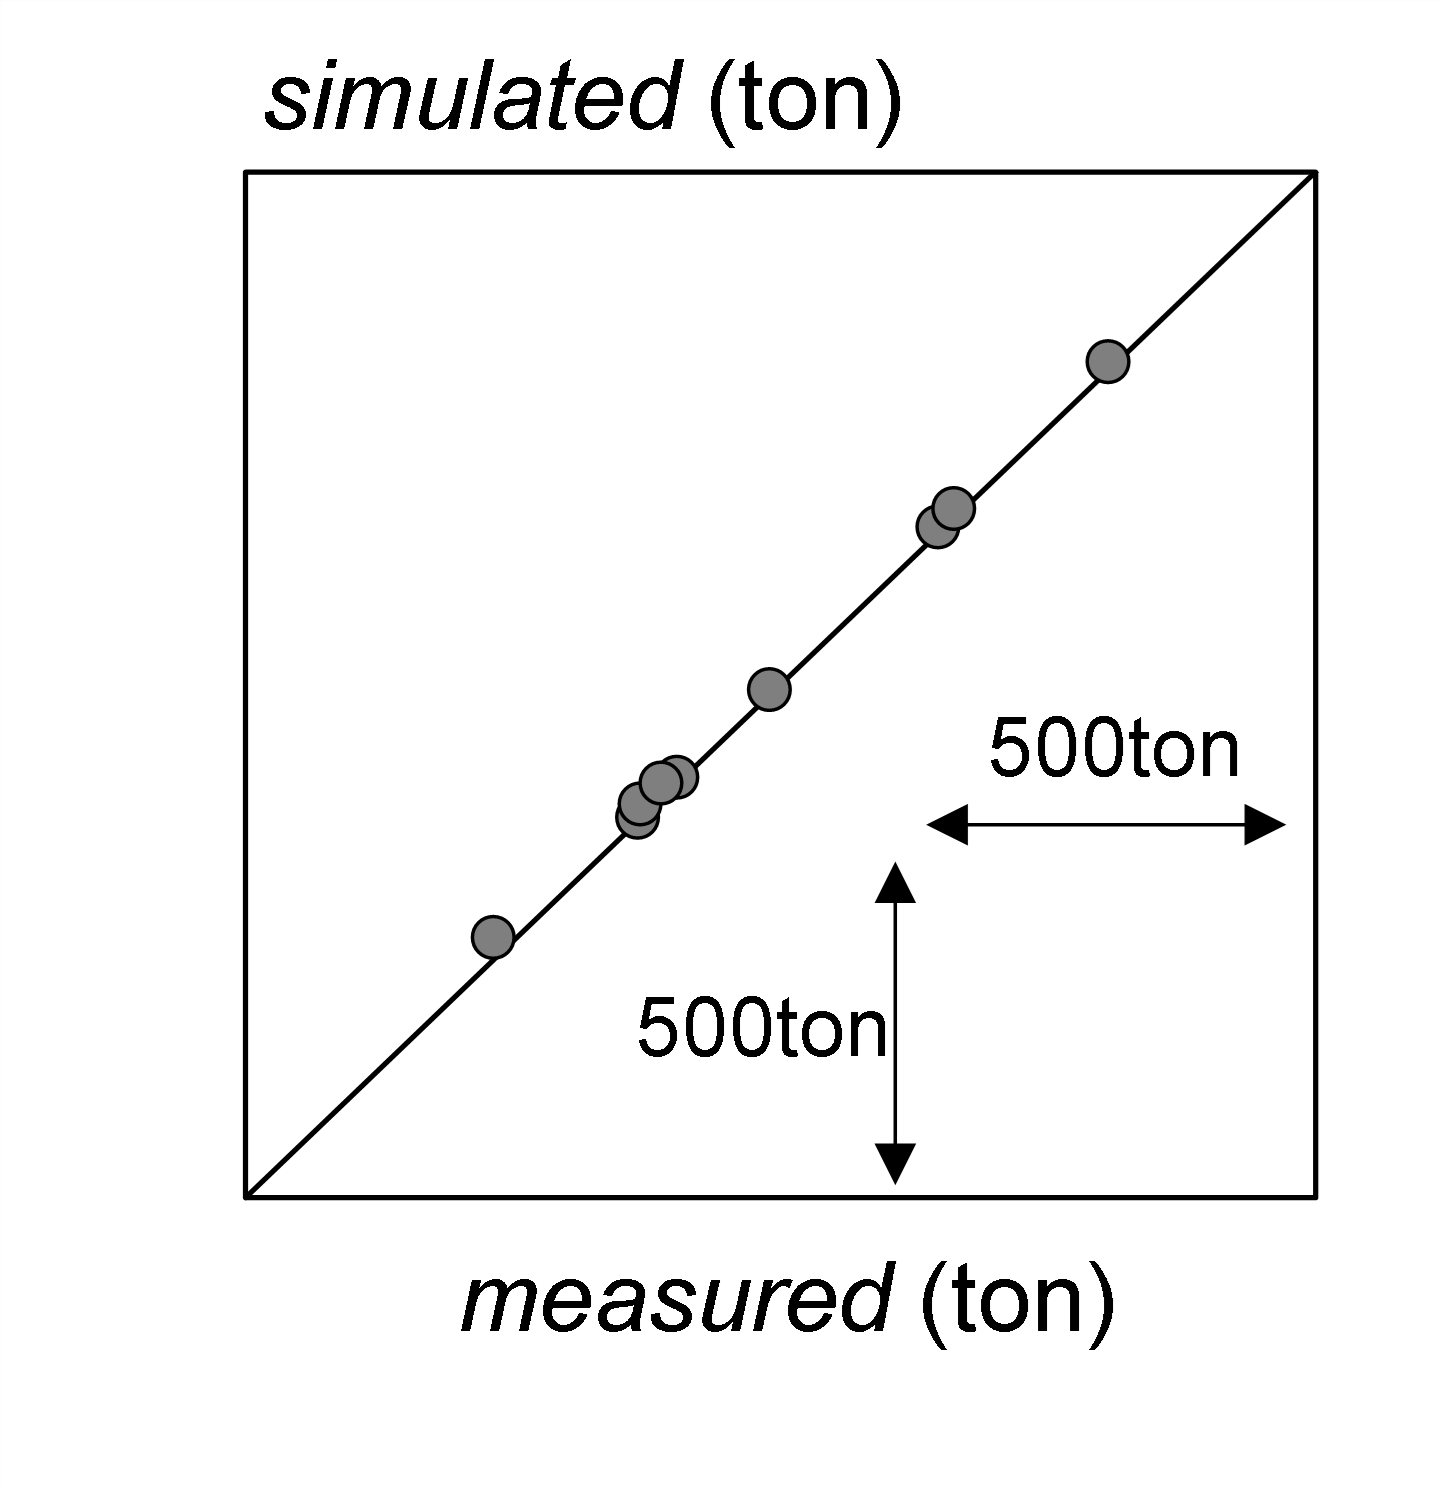
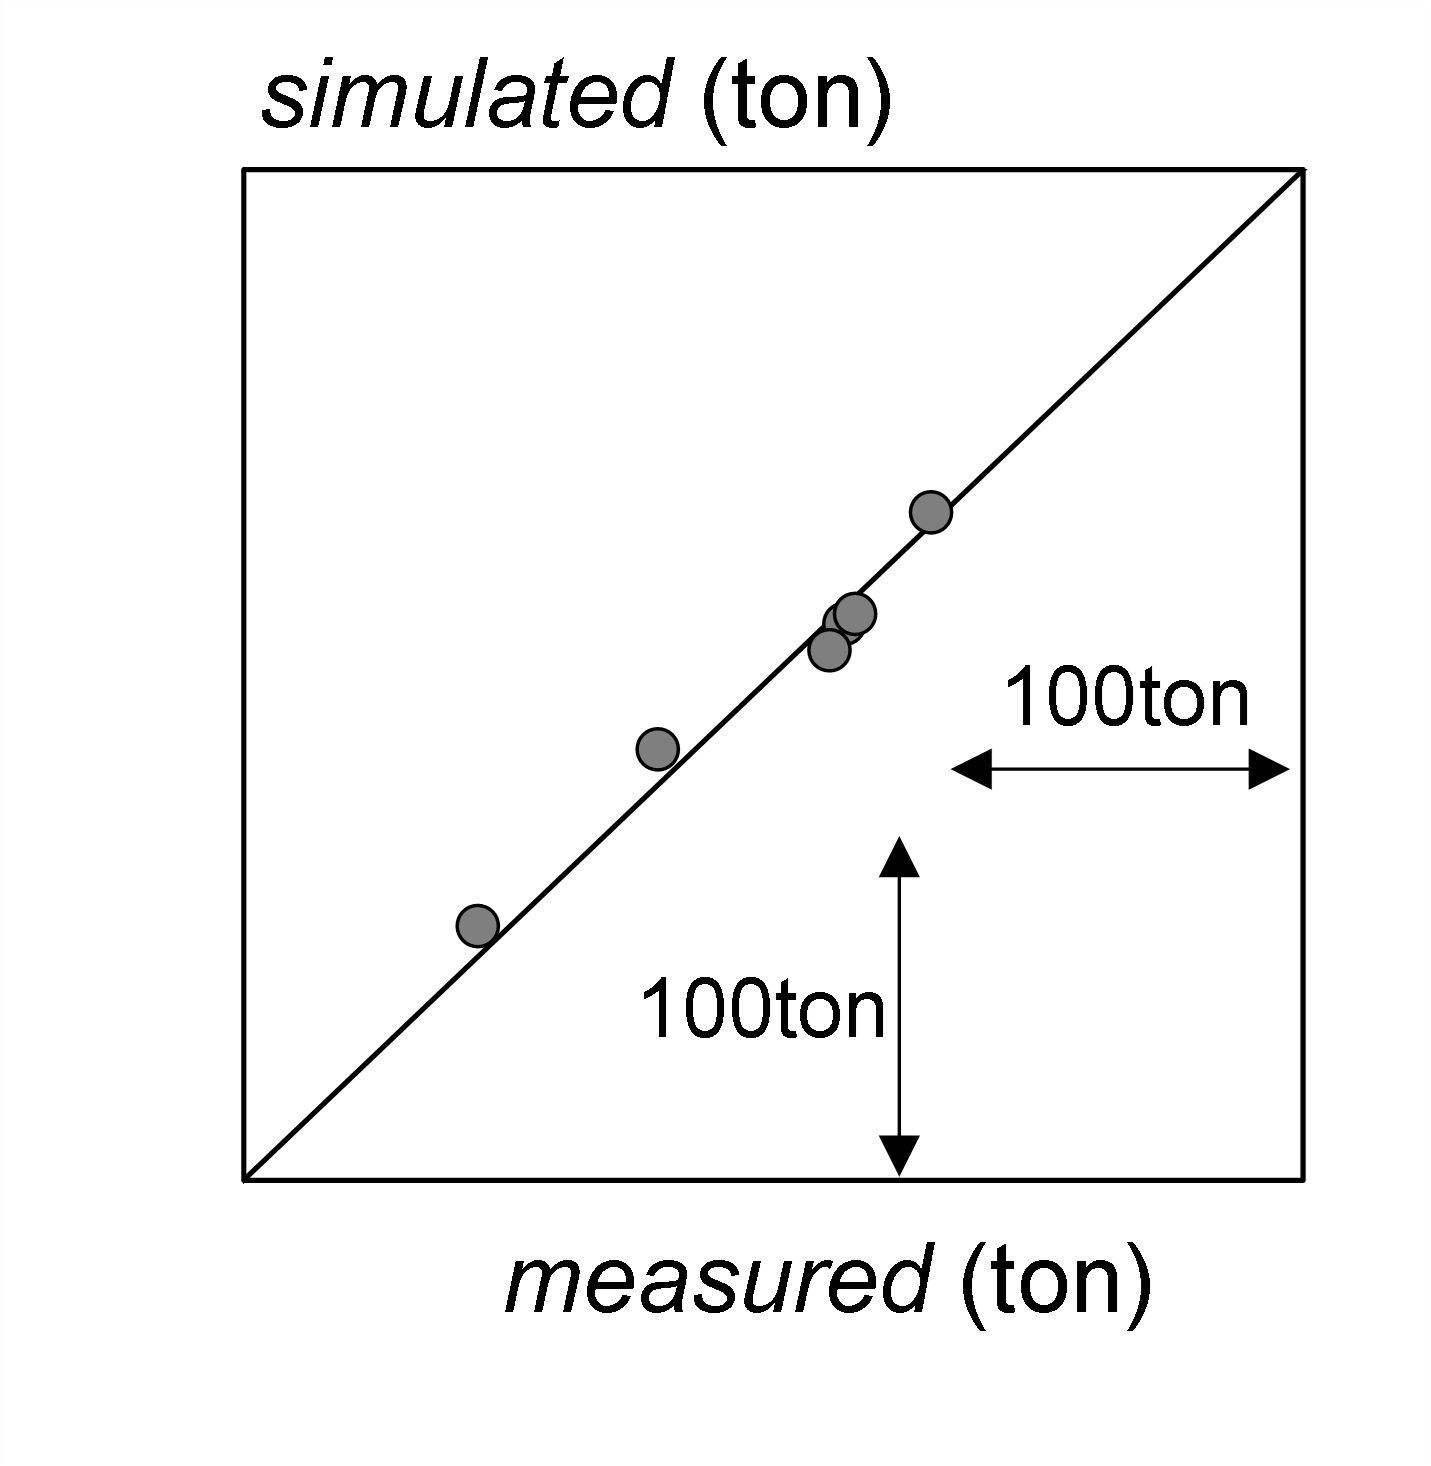
Validation of Assessment Method by Comparison between Results of Fuel Consumption Simulation and Onboard Monitoring Data
(left: Container ship, right:Tanker)
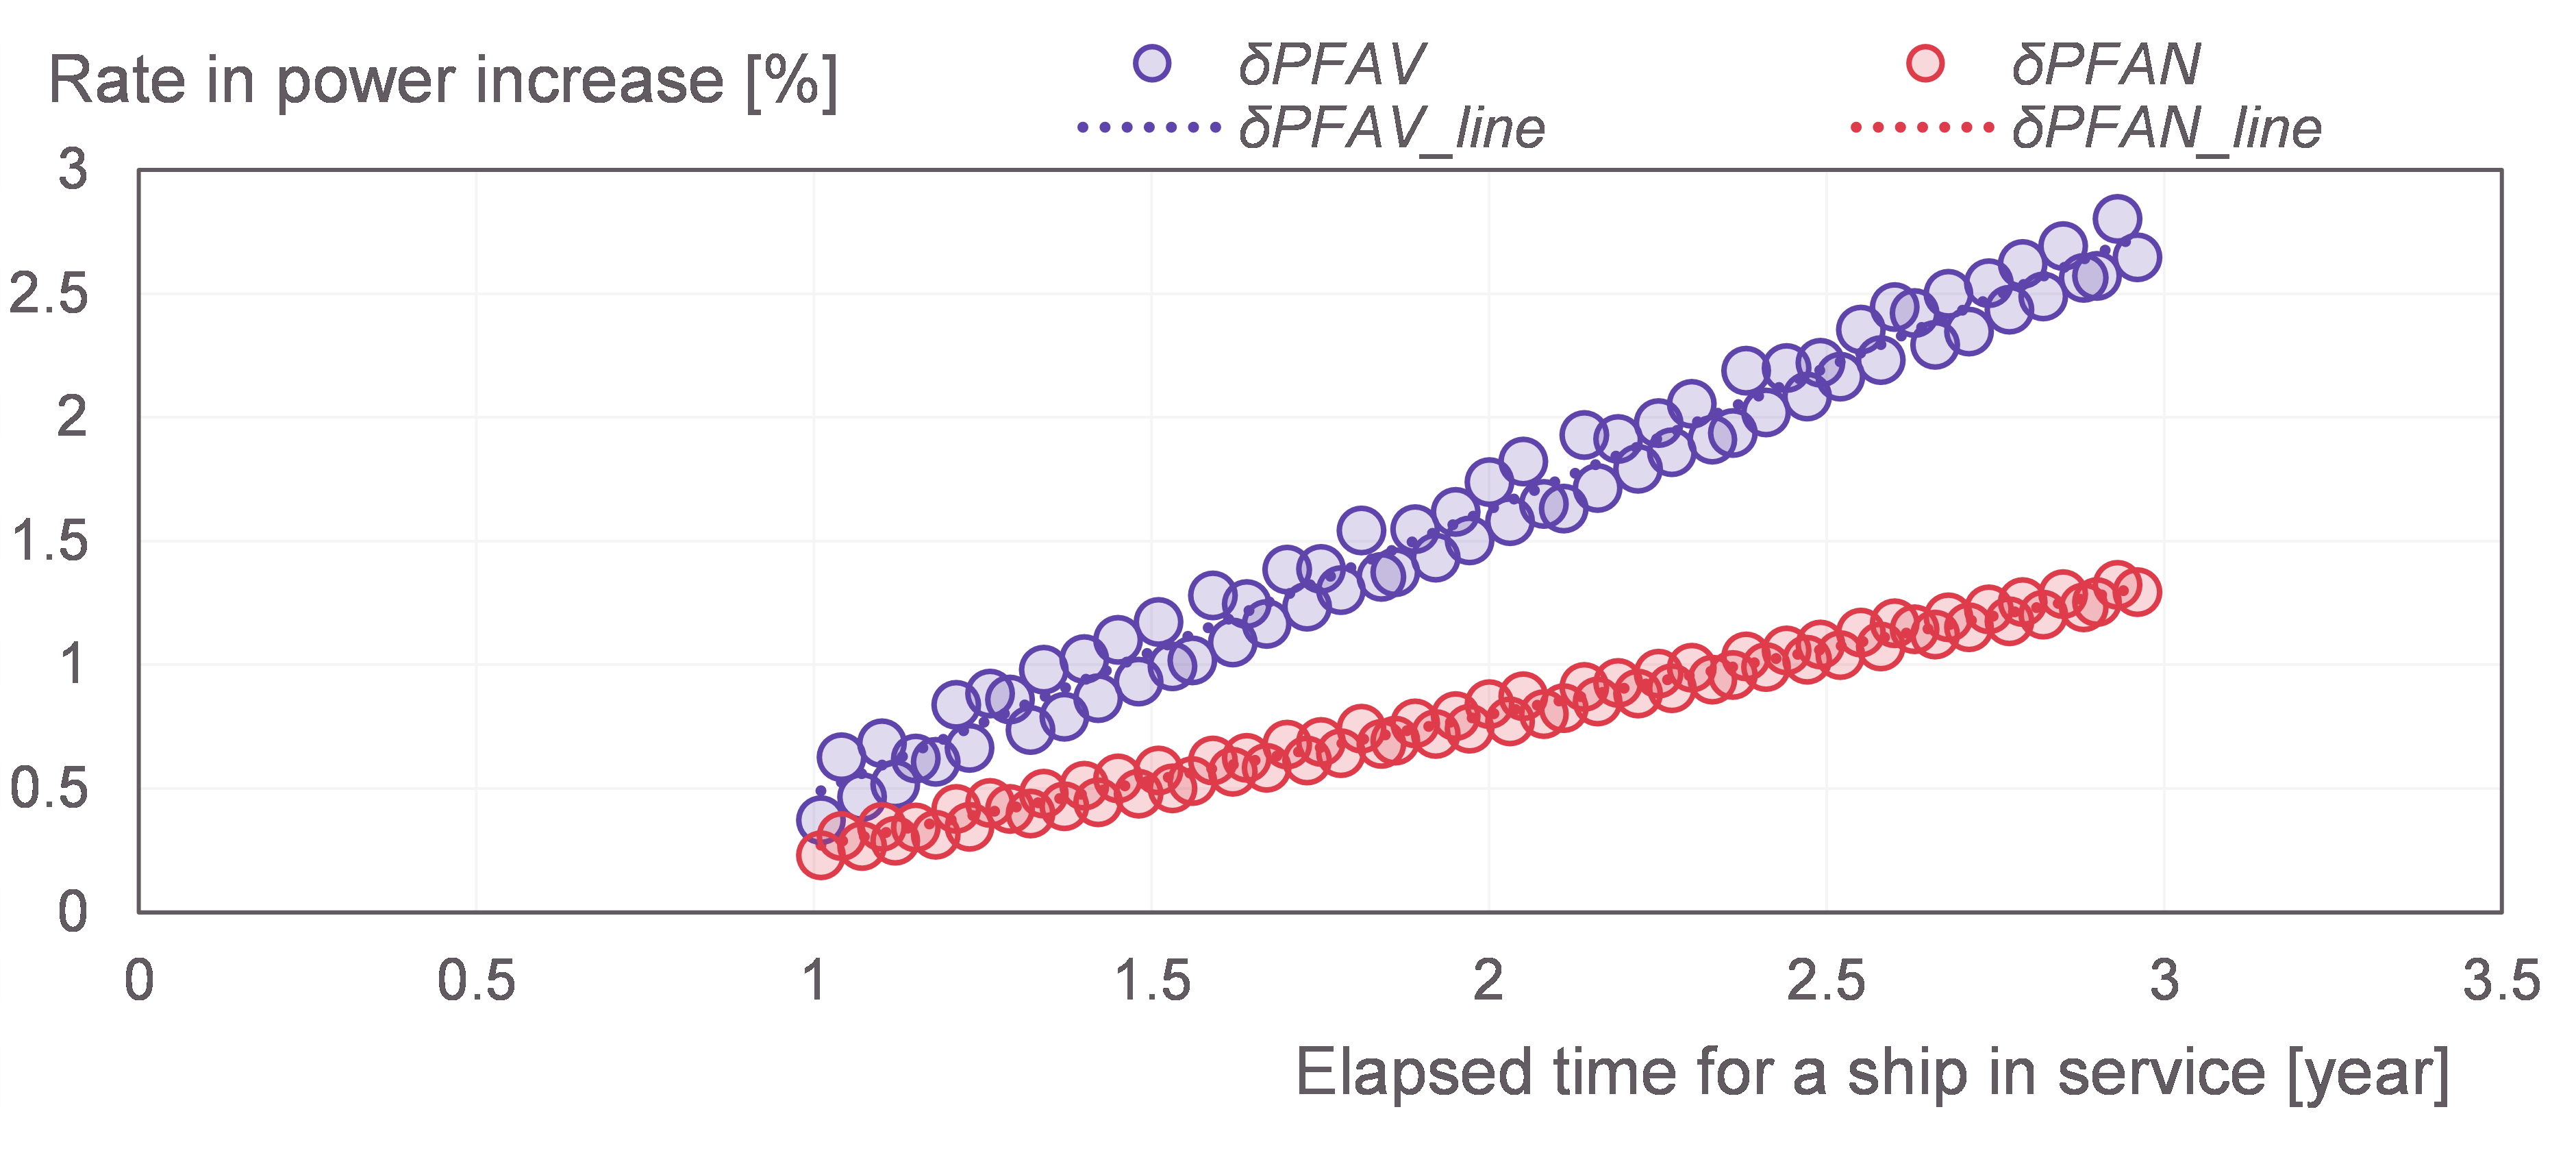
(4) Assessment of Impact of Fouling and Aging
SALVIA-OCT.-web. can be used to assess the impact of fouling and aging based on long-term onboard monitoring data. The figure below shows an example of the assessment. dPFAV and dPFAN represent the rate of increase in main engine power due to fouling and aging at a constant ship speed and a constant rotational speed, respectively. The dotted lines in the figure are the approximation lines of dPFAV and dPFAN.
Results of Assessment of Ship Performance in Still Water based on Onboard Monitoring Data
(5) Quality Assessment of Onboard Monitoring Data (Evaluation of Variations)
SALVIA-OCT.-web. assesses the effectiveness of formula approximation of onboard monitoring data with different filtering thresholds for the weather conditions based on data variations around an approximation curve. This assessment confirms that the formula approximation was performed appropriately and quantitatively defines the effectiveness of data filtering by weather conditions performed in (1).
To use this application
This application is available in full version and limited version(free).
To use this application, you must apply for membership registration which includes the signing of a written license agreement with NMRI.
Please go to the Registration page to register.
Application website
Fees:
- 330,000 JPY half-yearly
- 440,000 JPY annually
Fees for ShipDC-API:
- 36,000yen for one ship annually
- The fee is based on JST.
- The fee is charged for one year until March 2.
- To use the ShipDC data, you need to apply for the IoS-OP service provided by ShipDC. Please contact ShipDC (https://www.shipdatacenter.com/) for details.
Fees for POLARIS Hindcast:
- The fee is based on the number of data points acquired in a month, and is charged as shown in the Table1 (rounded down to the nearest whole number).
Table1 Number of data points and fee (The fee is the same for “Global Data” or “Coastal Data around Japan“)
| number of data points | fee |
|---|---|
| 1 ~ 730 | 33,000 yen constant |
| 731 ~ 87,600 | 33,000 yen + 35.20 yen/data |
| Maximum 2,200,000 yen | |
| 87,601 ~ 438,000 | 2,200,000 yen + 9.90 yen/data |
| Maximum 4,400,000 yen | |
| 438,001 ~ 1,752,000 | 4,400,000 yen + 3.96 yen/data |
| Maximum 8,800,000 yen | |
| 1,752,001 ~ | 8,800,000yen + 3.63 yen/data |
- The fee is based on UTC.
- “Global Data” and “Coastal Data around Japan” are billed separately.
- The fee is finalized at the end of each month, and is billed quarterly.
- The users of SALVIA-OCT.-web free version can acquire up to 4,500 data points.
| POLARIS Hindcast data description | ||
|---|---|---|
| Global/Coastal1) | Global data (package2):T1st) | Coastal data around Japan |
| Items reflected on SALVIA-OCT.-web | Wind :
Mean wind speed, Mean wind direction Wave (Wind waves, swells): Significant wave height, Mean wave period, Peak wave direction |
Wind :
Mean wind speed, Mean wind direction Wave (resulting waves): Significant wave height, Significant wave period, Mean wave direction |
| Range | Latitude: 75°N ~ 75°S Longitude: All |
Latitude: 20°N ~ 50°S Longitude: 120°E ~ 150°W |
| Data Period3) | Over the past five years | Over the past five years |
- 1) Both “Global data” and “Coastal data around Japan” can be used with a POLARIS application.
- 2) Packages: For the “Global data”, you can select “Standard”, “T1st”, “MaxDir”, or “T2nd” as your package. When using within SALVIA-OCT.-web, please select T1st (default). For details on packages and data definitions, please contact the service provider, the Japan Weather Association (https://www.jwa.or.jp).
- 3) The data period covers the past five years (the most recent five years for which data is available). Data updates are conducted around the middle of each month.
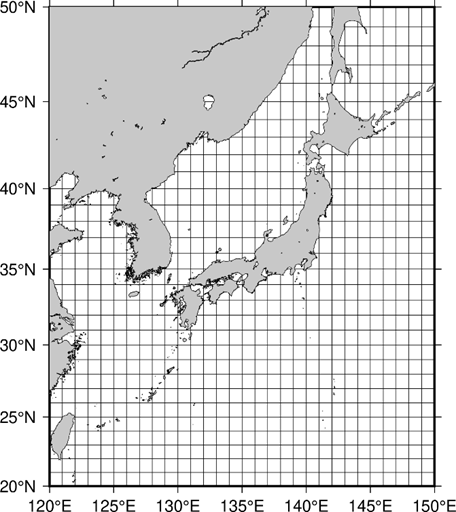
The Range of “Coastal data around Japan”
References
1)A. Sakurada, N. Sogihara and M. Tsujimoto: Development of a Filtering Method for the Evaluation of Performance in Calm Sea Based on Onboard Monitoring Data, Journal of the Japan Society of Naval Architects and Ocean Engineering, Vol. 31, pp. 29-37, 2020.
2)A. Sakurada, N. Sogihara, M. Tsujimoto, and H. Sato: Development of Resistance Criteria Method for Ship Performance Evaluation by Onboard Monitoring Data, Proceedings of Full Scale Ship Performance Conference 2021, pp.19-26, 2021.
3)N. Sogihara, A. Sakurada and M. Tsujimoto: Validation of Filtering Method for Evaluating Ship Performance in Calm Sea Using Onboard Monitoring Data, Journal of the Japan Society of Naval Architects and Ocean Engineering, Vol. 33, pp. 25-33, 2021.